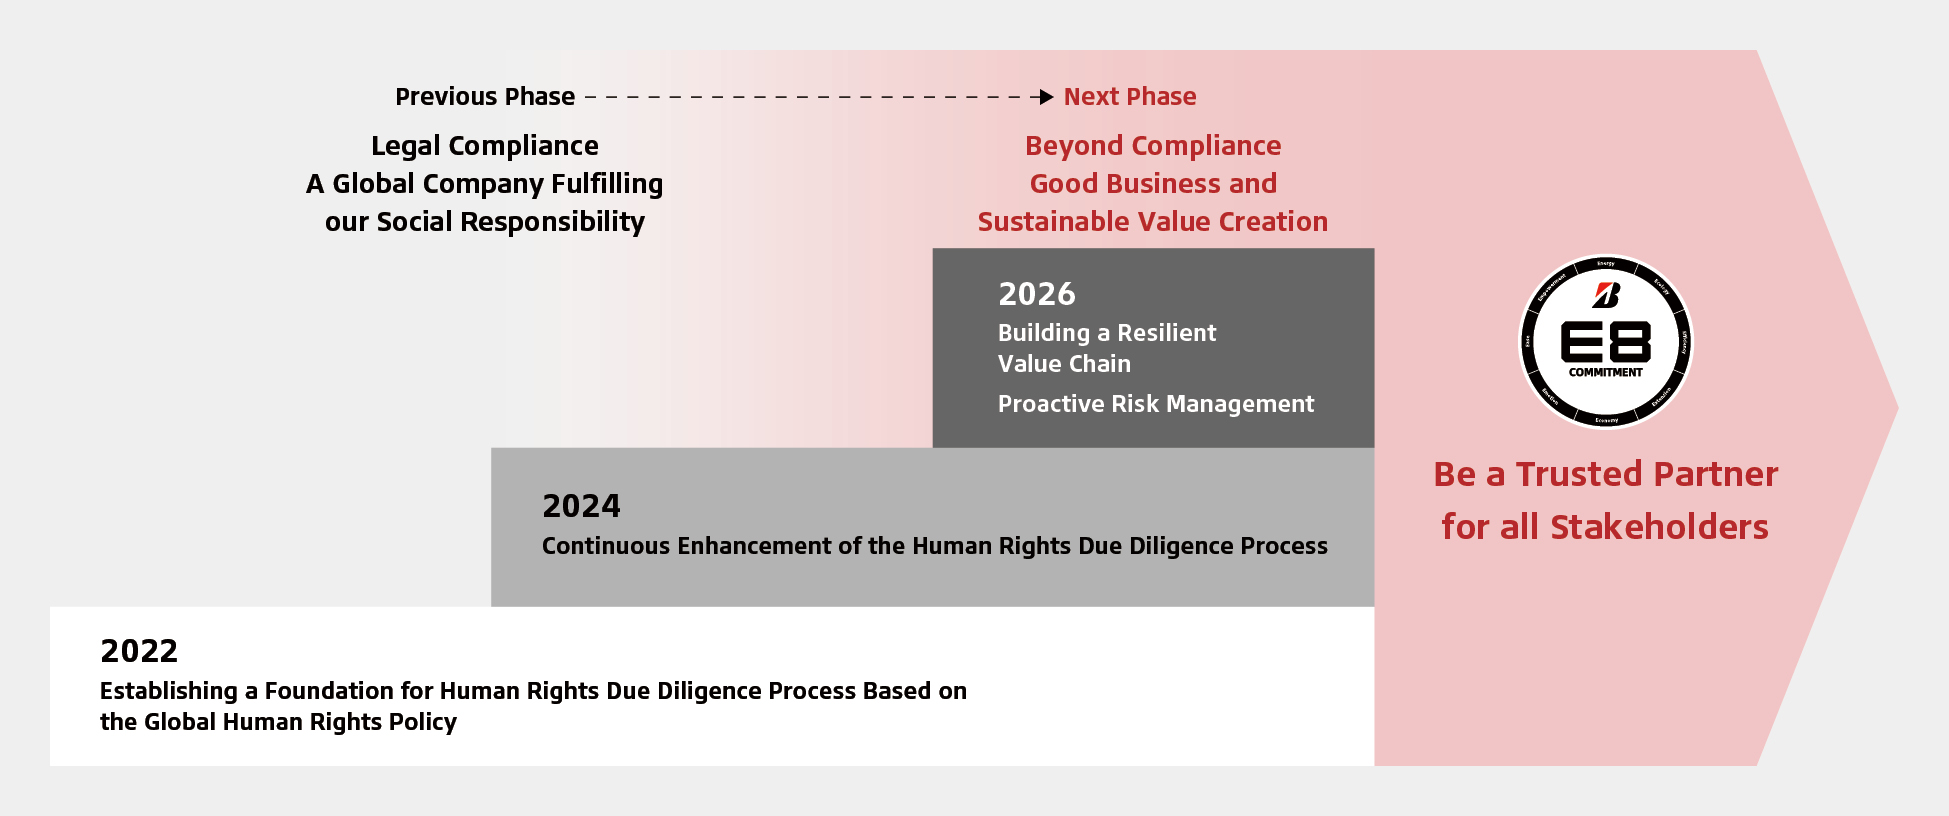
As part of its dedication to being a true global leader in all that it does, Bridgestone is committed to respecting human rights and advancing responsible labor practices throughout its worldwide operations. This commitment is the right thing to do and consistent with Bridgestone’s vision of providing social and customer value as a sustainable solutions company. It is also fundamental to fulfilling the “Bridgestone E8 Commitment” (one of the values of which is “Empowerment”), by contributing to a society that ensures accessibility and dignity for all. To achieve this aim, Bridgestone is committed to working collaboratively with stakeholders, including affected and potentially affected groups, to address and remedy adverse impacts from its operations, products or services.
Bridgestone continues to embed respect for human rights and the Global Human Rights Policy in its day-to-day operations. The policy articulates Bridgestone’s stance on internationally recognized human rights principles, and outlines the behaviors that all internal and external stakeholders around the globe can expect from Bridgestone and its business partners. The policy clearly states Bridgestone’s respect for diversity, equity and inclusion, prohibition of discrimination and harassment, focus on workplace health and safety, commitment to responsible labor practices, and protection of freedom of association and collective bargaining. The policy also guides the organization as it strives to uphold human rights principles through interactions with employees, consumers, customers, suppliers, contractors and community members wherever it conducts business. In further support of this policy, Bridgestone is committed to respecting and supporting the UN Guiding Principles for Business and Human Rights (UNGPs) as well as the human rights set out in the International Bill of Human Rights (IBHR) and the International Labor Organization’s Declaration on Fundamental Principles and Rights at Work. We also expect our business partners, including our suppliers, contractors, vendors and customers, to uphold the principles set out in this policy. These expectations are aligned with Bridgestone’s Code of Conduct and Global Sustainable Procurement Policy.
The Global Human Rights Policy is endorsed by the Global Executive Committee (Global EXCO) and upheld by the Global CEO, as reflected by his signature on the policy upon its revision in 2022. This demonstrates Bridgestone’s universal and consistent commitment to respecting the internationally recognized human rights principles laid out in the aforementioned international standards.
This mission is important to Bridgestone, as stakeholders and society increasingly hold businesses, and especially large global organizations, accountable for their specific human rights commitments and subsequent actions. Bridgestone proactively incorporates human rights initiatives into its business models and across its value chains, priorities, management policies, and business strategies. With these actions, Bridgestone is creating social and customer value and building trust with stakeholders.